
Morphometric Evaluation of Wedging Index, Pedicle Index, Canal-to-Body Ratio, and Canal Spinal Index in Dry Human Lumbar Vertebrae: Anatomical Implications for Lumbar Instrumentation and Spinal Canal Assessment
Swati Rohilla , Susmita Saha , Prachi Saffar Aneja , Neeru Kapur , Tara Sankar Roy · Int J Anat Res 2026;14(3):9661–9669
1 PhD scholar, Department of Anatomy, SGT Medical College, Gurugram, India.
2 Professor, Department of Anatomy, SGT Medical College, Gurugram, India.
3 Head & Professor, Department of Anatomy, SGT Medical College, Gurugram, India.
4 Professor, Department of Radiology, SGT Medical College, Gurugram, India.
5 Head & Professor, Department of Anatomy, NDMC Medical College, Delhi, India.
Corresponding Author: Swati Rohilla, PhD Scholar, Department of Anatomy, SGT Medical College, Gurugram-122505. India. · swatirohilla18@gmail.com
Abstract
Background
This study aims to evaluate the anatomical and surgical significance of the Wedging Index (WI), Pedicle Index (PI), Canal-to-Body Ratio (CBR), and Canal Spinal Index (CSI) in dry human lumbar vertebrae.
Methods
A total of 100 dried adult lumbar vertebrae (L1–L5) were analysed using a digital Vernier caliper. Measurements of the spinal canal, pedicle, and vertebral body were obtained, and the Wedging Index (WI), Pedicle Index (PI), Canal-to-Body Ratio (CBR), and Canal Spinal Index (CSI) were calculated using standard formulas. Descriptive statistics, Pearson correlation, and one-way ANOVA were employed for data analysis.
Results
The WI increased from L1 (0.93 ± 0.07) to L4 (1.08 ± 0.15), indicating level-specific variation in vertebral body wedging. The PI increased slowly from L1 (0.53 ± 0.18) to L4 (1.13 ± 0.27), then dropped at L5 (0.51 ± 0.14). The CBR declined from L1 (0.53 ± 0.07) to L4 (0.40 ± 0.07), suggesting reduced canal capacity at lower lumbar levels. The CSI varied significantly between vertebral levels (ANOVA, p < 0.001). There was a strong positive correlation between CSI and CBR.
Conclusion
Lumbar vertebrae exhibit significant morphometric differences across levels. L4 demonstrated the lowest relative canal dimensions among the studied levels, which may have anatomical relevance to assessment of spinal canal adequacy. These findings may assist with implant design, radiograph interpretation, and spinal instrumentation planning.
BACKGROUND:
Lumbar spine is the major load-bearing axis of human skeletal system which sustains maximum biomechanical and complex kinematic forces [1]. As a result, the region is prone to degenerative diseases like lumbar spinal stenosis, spondylolisthesis and vertebral compression fractures [2]. Knowledge of the regional morphometry is immensely important for decompressive laminectomies and for transpedicular screw fixation [3]. Even a deviation of a millimetre during pedicle instrumentation may result in pedicle breach, neurological injury or dural rupture [4]. Therefore, establishing accurate, population-specific anatomical baselines have immense importance in the safety of these procedures and in designing the implants accordingly [5].
Standardised structural indices are essential for translating anatomical data into clinical practice. These indices represent quantitative measurements used to convert anatomical data into the language of the practising orthopaedic surgeon and to assist in clinical diagnosis The Wedging Index (WI) is a parameter for calculating severity of compression fracture and it is the primary element of lumbar lordosis [6]. The Pedicle Index (PI) describes the “safe zone” for screw courses, though it measures the cortical-cancellous structure [4, 7]. The Canal Spine Index and Canal Body Ratio (CBR) are subtle measures of osseous three-dimensional capacity [6]. These ratios help clinicians differentiate between secondary narrowing from soft-tissue hypertrophy and primary osseous stenosis by comparing the vertebral foramen area to the overall vertebral frame [8].
There is lack of morphometric data on the Asian population, because most of the conventional morphometric data is derived from the western population or those using imaging techniques such as MRI and CT [5, 9]. These techniques are indispensable when performed in vivo and severe technical limitation if applied to establish true osseous baselines. Plain radiograph by itself can magnify the images by 10 to 15% due to radiation divergence [10]. CT may obscure many cortical borders secondary to slice thickness averaging and partial-volume effect leading to inaccurate measure of pedicles [11]. MRI gives limited detail of cortical bone so perimeter delineation is a subject to observer interpretation. Examining direct dry lumbar vertebrae, using digital caliper was considered to be gold standard as it offered the anatomical precision [7, 11]. The use of actual dry bone provided an accurate, unconfounded record of spinal geometry prior to any soft tissue change [5].
This study aims to determine the Wedging Index, Pedicle Index, Canal Body Ratio & Canal Spine Index in dry human lumbar vertebrae on the basis of precise measurements and eliminating the artifact of imaging technologies. By this, establishment an accurate, population specific data base may be developed applicable for pre-operative planning, increased precision of radiological interpretations, & the designing of Transpedicular instrumentation/implants.
Materials and Methodology
Study Design and Specimen Selection: This cross-sectional osteological study was done on 100 dried adult lumbar vertebrae existing in the collection of Department of Anatomy. Ethical clearance was obtained from the Institutional Review Committee (IEC/FMHS/PhD/2024-09). All intact and well-preserved lumbar vertebrae, both typical (L1-L4) and atypical (L5), were included irrespective of sex.
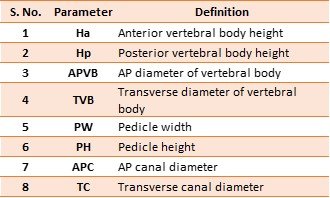
Data Acquisition: The linear parameters used the dried lumbar vertebrae. The vertebra was measured using a digital Vernier Caliper with accuracy of 0.01mm. The primary morphometric parameters recorded are presented in Table 1.
Table 1: Morphometric parameters measured in the present study.
Morphometric Indices
Four established morphometric indices—Wedging Index (WI), Pedicle Index (PI), Canal-to-Body Ratio (CBR), and Canal Spinal Index (CSI)—were calculated from the recorded measurements. This approach allows for comparison while minimising the effects of variation in vertebral size. The listed formulas are used for the calculation (Table 2).
Table 2: Morphometric indices calculated in the present study.
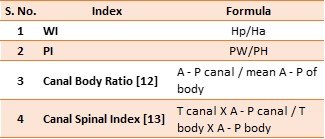
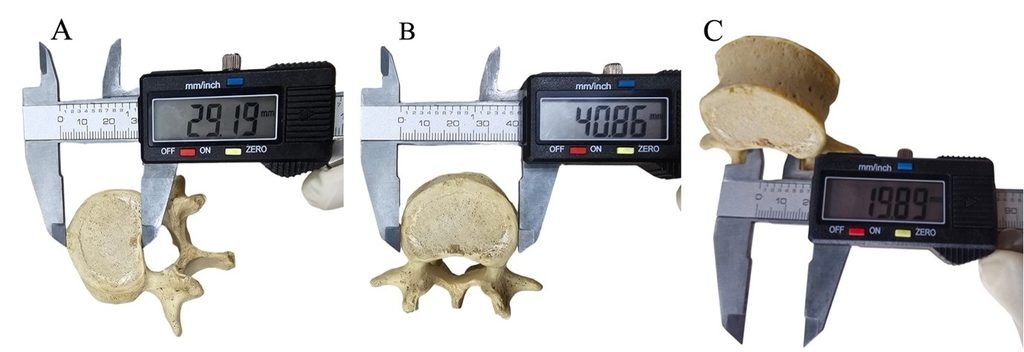
Fig.1: Direct osteometric measurement of a dry human lumbar vertebra using a digital Vernier calliper. (A) Measurement of the mid-sagittal anteroposterior (AP) diameter of the vertebral body at the superior level (B). Measurement of the transverse diameter (width) of the vertebral body at the superior level (C). Measurement of the transverse diameter of the vertebral canal.
Statistical Analysis: Data were analysed using SPSS version 28 (IBM CORP). Descriptive statistics (mean, standard deviation, and range) were calculated for all dimensions and indices by lumbar level. Paired Student’s t-tests (p < 0.05) assessed bilateral differences in pedicle dimensions, and one-way ANOVA (p< 0.001) evaluated changes across lumbar levels (L1–L5).
Results:
A total of 100 dry lumbar vertebrae were studied, and measurements were obtained for vertebral body and canal diameters. These data were subsequently used to calculate the Wedging Index, Pedicle Index, Canal-to-Body Ratio, and Canal Spinal Index.
Vertebral morphometric parameters: Descriptive data on vertebral body, pedicle, and vertebral canal measurements were collected from 100 dry lumbar vertebrae. These measurements, presented in Tables 3–6, formed the basis for calculating the morphometric indices.
Table 3: Descriptive statistics of anterior and posterior vertebral body height.
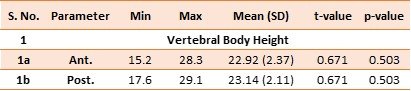
Table 4: Descriptive statistics of transverse diameter (vertebral body width) and anteroposterior vertebral body diameter at superior and inferior levels.
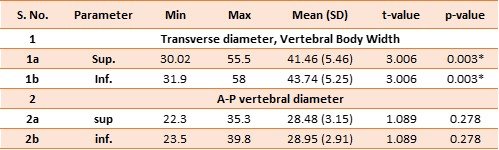
Table 5: Descriptive statistics of transverse and anteroposterior diameters of the vertebral canal.
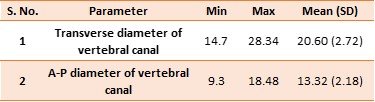
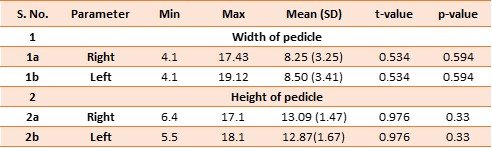
Table 6: Descriptive statistics of pedicle width and pedicle height on right and left sides.
Calculation of Structural Indices:
The lumbar spine was evaluated across five vertebral levels (L1–L5). Table 7 summarizes the mean and standard deviation for the Lumbar Wedging Index, Pedicle Index, Canal-to-Body Ratio (CBR), and Canal Spinal Index (CSI).
Table 7: Mean values and standard deviations of calculated morphometric indices across human lumbar vertebral levels (L1–L5).
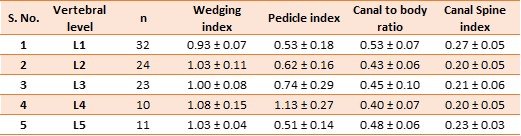
Wedging Index: The Lumbar Wedging Index is seen clearly to change across the vertebral bodies from L1 to L5 levels. The mean at the L1 level demonstrates mild anterior wedging (mean = 0.93) which gradually changes, resulting in neutral or posterior wedging in the lower lumbar levels where it peaks at the level of L4. (mean = 1.08) This change in shape at the levels between L1 and L5 is needed to retain the natural lumbar-lordotic curve of the lower spine (Fig 2).
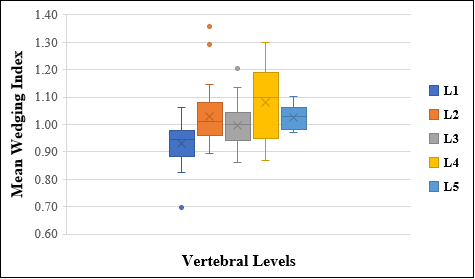
Fig. 2: Box plot illustrating the distribution of the Wedging Index across lumbar vertebral levels (L1–L5). The interquartile range is represented by the middle boxes, the median is shown by the horizontal inner lines, the mean is indicated by the ‘×’, while data outliers are indicated by solitary dots.
Pedicle Index: The mean pedicle index increases from L1 (0.53 ± 0.18) to L4 (1.13 ± 0.27), changing from a vertical oval shape (PI<1.0) in the upper lumbar spine to a transverse oval shape (PI>1.0) at L4 level. At L5 (0.51 ± 0.14), this value falls again to become like a vertical oval again. The fact that the pedicle index is highest at L4 means that this segment is the one with the widest pedicle widths which shows an important anatomical difference (Fig 3).
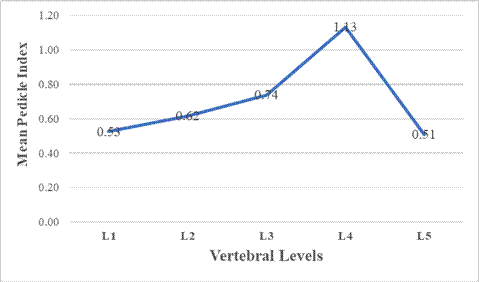
Fig. 3: Mean Pedicle Index values across the five lumbar vertebral levels, demonstrating a distinct structural peak at L4.
Canal to Body Ratio (Torg Pavlov method): The CBR decreased slowly from the upper lumbar levels L1 (mean = 0.53) to L4 (mean = 0.40), then slightly increased at L5 level (0.48 ± 0.06). A one-way ANOVA showed significant difference in canal to body ratio across lumbar levels confirming the lumbar levels variation (F = 8.47, p < 0.001*). The study confirms that lower lumbar level has narrower vertebral canal relative to its body. This was prominent at the level L4 where canal to body ratio was less than the above. (Fig 4).
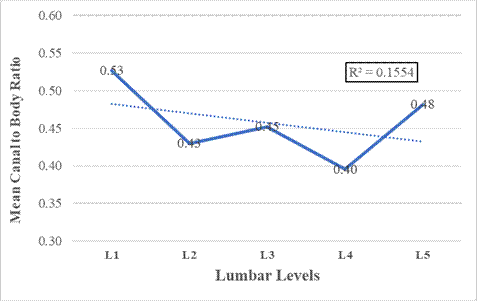
Fig. 4: Variation of the mean Canal-to-Body Ratio across lumbar levels L1–L5. The dashed line represents the linear trend (R2 = 0.1554), highlighting the overall reduction in spatial capacity toward the lower lumbar spine.
Canal Spinal Index (Jones’s Spinal Index): Canal Spinal Index (Jones’s Spinal Index): The Canal Spinal Index varied across the lumbar vertebral levels, with the highest mean value observed at L1 (0.27 ± 0.05) and the lowest at L4 (0.20 ± 0.05). A marked decrease in CSI was evident from L1 to L2, followed by relatively stable values at L2, L3, and L4, with a slight increase at L5 (0.23 ± 0.03). One-way ANOVA demonstrated a statistically significant difference in CSI among the lumbar vertebral levels (F = 8.98, p < 0.001). Post hoc analysis revealed that L1 had significantly higher CSI values than L2, L3, and L4, whereas no significant difference was observed between L1 and L5. Similarly, no significant differences were found among L2, L3, L4, and L5. Overall, the findings indicate a progressive reduction in the relative size of the vertebral canal from the upper to the lower lumbar spine, with a modest increase at L5 (Fig. 5).
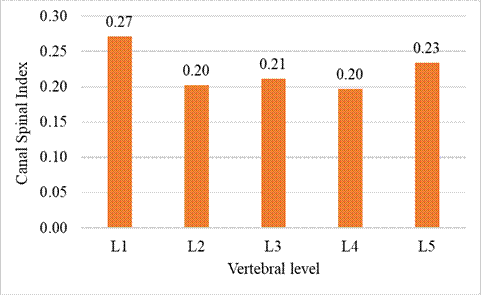
Fig. 5: Bar graph showing the mean Canal Spinal Index (CSI) at different lumbar vertebral levels (L1–L5) in dry lumbar vertebrae. The mean CSI was highest at L1 and lowest at L4. Differences among vertebral levels were statistically significant (One-way ANOVA, F = 8.980, p < 0.001*).
Correlation between lumbar wedging index and pedicle index: Pearson correlation analysis was conducted to assess the relationship between the Wedging Index and the Pedicle Index across the five lumbar vertebral levels (L1–L5). The Wedging Index ranged from 0.93 to 1.08, while the Pedicle Index varied from 0.51 to 1.13. The analysis revealed a moderate positive correlation (r = 0.69), with a coefficient of determination (R² = 0.481), although this was not statistically significant (p = 0.196), potentially due to the limited sample size. The findings indicate a trend in which higher Wedging Index values correspond to higher Pedicle Index values, particularly at L4, which showed the highest values for both indices (Fig. 6).
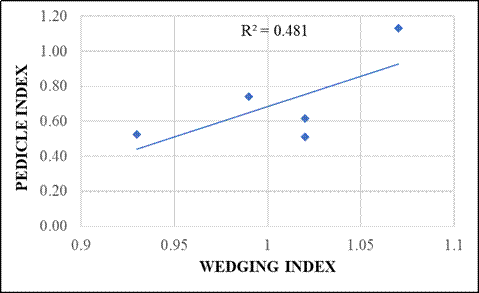
Fig. 6: Scatter plot demonstrating the moderate positive correlation (R2 = 0.481) between the Wedging Index and Pedicle Index across lumbar levels L1–L5.
Correlation between canal to body ratio and canal spinal index: Pearson correlation analysis demonstrated a very strong positive correlation between the Canal-to-Body Ratio (CBR) and the Canal Spinal Index (CSI) (r = 0.96, p < 0.001*). The coefficient of determination (R² = 0.928) indicated that approximately 92.8% of the variability in CSI could be explained by variations in CBR. These findings suggest that vertebrae with a higher Canal-to-Body Ratio consistently exhibit higher Canal Spinal Index values, indicating a strong linear association between these two morphometric indices (Fig. 7).
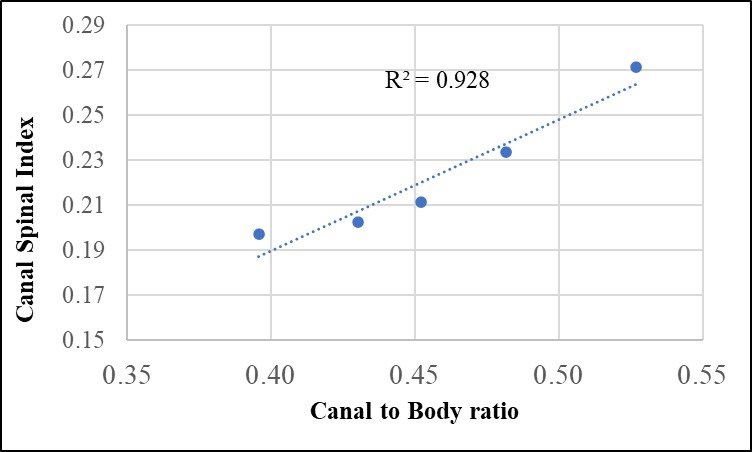
Fig. 7: Scatter plot demonstrating the strong, statistically significant positive correlation (R2= 0.92) between the Canal-to-Body Ratio and the Canal Spinal Index across lumbar levels L1–L5.
Morphometric Synergy Between Canal Spinal Index and Canal-to-Body Ratio: Analysis of the mean values across the five lumbar vertebral levels (L1–L5) demonstrated a similar pattern of variation for the Canal Spinal Index (CSI) and the Canal-to-Body Ratio (CBR). Both indices exhibited their highest mean values at L1, followed by a marked decline at L2, relatively stable values at L3 and L4, and a slight increase at L5. Pearson correlation analysis of the vertebral-level mean values revealed a very strong positive association between CSI and CBR (r = 0.96, R² = 0.928, p < 0.001). The coefficient of determination indicated that approximately 92% of the variation in CSI was explained by variations in CBR. These findings demonstrate that changes in the Canal Spinal Index closely parallel changes in the Canal-to-Body Ratio across the lumbar vertebral levels, indicating that both indices consistently reflect the relative dimensions of the vertebral canal in relation to the vertebral body (Fig. 8).
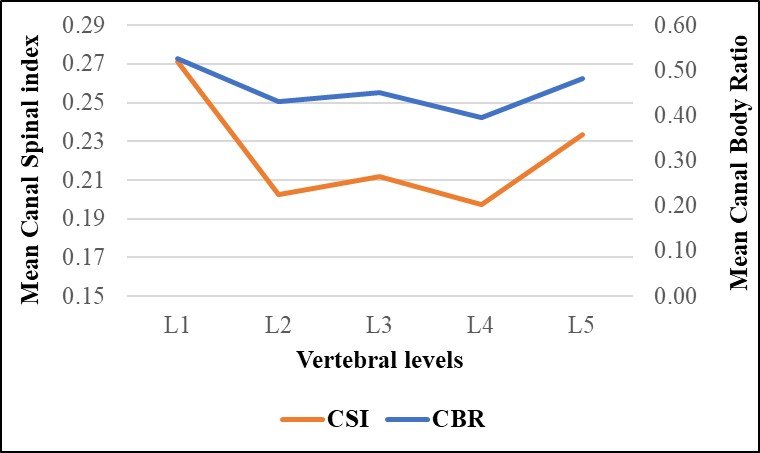
Fig. 8: Dual-axis graph demonstrating the strong positive correlation between the mean Canal Spinal Index (orange line) and Canal-to-Body Ratio (blue line) across lumbar levels L1–L5, with both indices reaching a spatial nadir at L4.
Discussion:
The aim of present osteometric study was to provide normative values for Wedging Index (WI), Pedicle Index (PI), Canal-to-Body Ratio (CBR) and Canal Spinal Index (CSI) performed on dry lumbar vertebrae. These indices are related to parameters like shape of vertebral body, pedicle shape and spinal canal size. These are important from biomechanical, instrumentation and understanding of lumbar spinal disorders [15]. However, normative values may vary across regions, countries, and racial or ethnic populations because of anthropometric differences. These cannot be applied by forensic experts across different populations without studying each area specifically.
The upper and lower lumbar segments show gradual changes in vertebral body shape. The Wedging Index gradually increased from L1 (0.93) to L4 (1.08), where upper lumbar spine shows anterior wedging and at lower lumbar level show posterior wedging giving and support to lumbar lordosis biomechanics. Been E et al. shown that lumbar curvature results from the combined wedging of vertebral bodies and discs, particularly in the lower lumbar spine [15]. Increased posterior vertebral body height in the lower lumbar vertebrae contributes to maintaining sagittal alignment and efficient load transfer.
Pedicle Index increased from L 1 level (0.53) to L 4 level (1.13) before abruptly drooping at L 5 level (0.51), which demonstrates increasing transverse pedicle in lower lumbar spine, where wider pedicle is shown effective for load transfer toward sacrum with increasing biomechanical load in lower lumbar vertebrae [16]. The differences in regions important for surgery, due to the shape difference in pedicle, which screw to be selected according to diameter, length and direction of placement when fixing the vertebrae [17].
The Canal-to-body Ratio, there is a moderate increase in this at L5 level (0.48) having slowly decreased from L1 (0.53) to L4 (0.40). This signifies the vertebral canal becomes relatively smaller in the mid-lumbar region, its smallest size at L4. This narrowing at L4 might be an explanation that in the clinical practice lumbar canal stenosis mostly occurs at this level. Shrestha et al. also found Lower canal-body ratios were recorded at the mid lumbar spine with the values higher for the lumbar vertebrae at the upper lumbar [14]. Since L 4-L 5 is mainly targeted by the degenerate compression of lumbar region, low canal to body is clinically the most important region [18]. Hence, further degenerative changes may show more propensity of the canal to cause the constriction with a comparatively smaller canal with respect towards the vertebral body.
The Canal Spinal Index also varied significantly between lumbar vertebral levels. Relatively lower values for mid-lumbar levels and highest values were seen for upper lumbar spine region. The statistically significant differences in the canal shape between different vertebral levels were seen with the one-way ANOVA (F = 8.980, p<0.001) test. These findings support earlier research showing that both developmental and biomechanical factors influence vertebral canal size, which changes in a predictable way along the lumbar spine [19]. Comparison of the present study with previous studies on lumbar vertebral morphometry are explained in Table 8.
One of the main findings of this study was the strong morphometric connection between the Canal-to-Body Ratio and the Canal Spinal Index. Both indices peaked at L1, declined till L4, and relatively recovered at L5, hence demonstrating the same pattern across the lumbar levels, which was a significant finding of this study. Correlation analysis showed a very strong positive relationship (r = 0.96, R² = 0.928, p < 0.001), meaning about 92.8%, meaning about 92.2% of the variation in one index matched the other. This clear agreement suggests that, even with regional differences, the lumbar spine keeps a consistent relationship between canal size and vertebral body size. Both indices measure how well the canal size matches the vertebral body, but the Canal Spinal Index also considers other geometric features. Their strong correlation suggests that the vertebral body and canal grow and adapt together during development. Other studies have found similar results, with higher canal-body ratios linked to larger canal capacity and less risk of stenosis [20].
Table 8: Comparison of the present study with previous studies on lumbar vertebral morphometry.
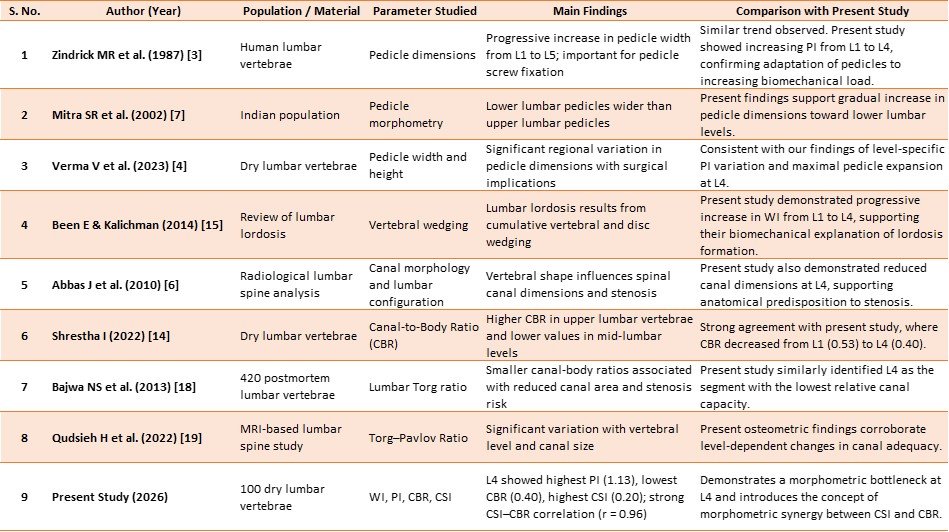
Table 9: Novel findings of the present study compared with previous literature.
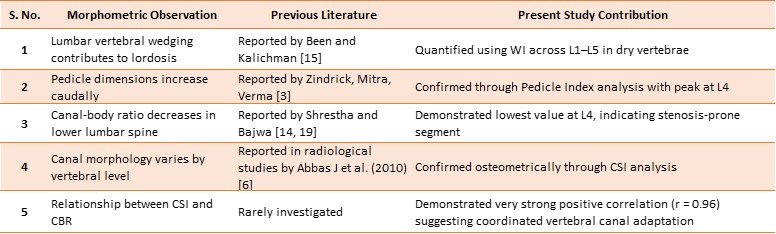
Strengths and Limitations: This study has several clinical implications. Knowledge of vertebral body, pedicle and canal morphometry is important for the effective preoperative planning, implant design, precise pedicle screws placement together with decompressive measures. Due to the marked regional and racial differences in vertebral dimensions, data about population-specific normal vertebral morphology would be valuable to clinicians. These baseline data might serve as guidelines in minimizing instrumentation-related complications and improving the interpretation of radiological assessments. The current study was performed on dry vertebrae for which either the age or sex was umknown. Additionally, level-wise mean values rather than individual vertebral measures were used in the morphometric synergy analysis. A more comprehensive understanding of lumbar vertebral morphology could be achieved through future studies incorporating larger sample sizes, sex-specific analysis, and advanced imaging correlations.
Conclusion:
This study indicates significant level-wise variations in lumbar vertebrae morphometry and the Canal Spinal Index and Canal-to-Body ratio exhibiting strong morphometric synergy. An anatomical basis for vulnerability to spinal stenosis is suggested by detection of functional synergistic bottleneck at L4 level due to high pedicle expansion of and reduced relative canal capacity at this level. This study strongly suggests the usage of morphometric indices for understanding the architecture of lumbar spine in surgical planning for evaluation of spinal canal adequacy. The results also provide valuable baseline anatomical data, highlighting stable, level-specific architectural transitions in the lumbar spine.
Competing interests: There is no competing interests between authors.
Author’s Contribution: All Authors contributed to the study conception and design. Material preparation, data collection and analysis were performed by Swati Rohilla, Susmita Saha, Prachi Saffar Aneja and Neeru Kapur. The first draft of the manuscript was written by Swati Rohilla, and all authors commented on previous versions of the manuscript and Tara Sankar Roy has done the data analysis and critical revision. All authors read and approved the final manuscript.
Cite this article: Swati Rohilla, Susmita Saha, Prachi Saffar Aneja, Neeru Kapur, Tara Sankar Roy. Morphometric Evaluation of Wedging Index, Pedicle Index, Canal-to-Body Ratio, and Canal Spinal Index in Dry Human Lumbar Vertebrae: Anatomical Implications for Lumbar Instrumentation and Spinal Canal Assessment. Int J Anat Res. 2026;14(3):9661–9669. DOI: 10.16965/ijar.2026.196
References
- Sengupta, Dilip K. MD, Dr Med.Clinical Biomechanics of the Spine. SPINE 42():p S3, April 1, 2017. https://doi.org/10.1097/BRS.0000000000002019
- Katz JN, Harris MB. Clinical practice. Lumbar spinal stenosis. N Engl J Med. 2008 Feb 21;358(8):818-25. https://doi.org/10.1056/NEJMcp0708097 PMid:18287604
- Zindrick MR, Wiltse LL, Doornik A, Widell EH, Knight GW, Patwardhan AG, Thomas JC, Rothman SL, Fields BT. Analysis of the morphometric characteristics of the thoracic and lumbar pedicles. Spine (Phila Pa 1976). 1987 Mar;12(2):160-6. https://doi.org/10.1097/00007632-198703000-00012 PMid:3589807
- Verma V, Agrawal U Sr. Lumbar Pedicle Morphometry of Dry Vertebral Columns in Relation to Transpedicular Fixation: A Cross-Sectional Study From Central India. Cureus. 2023 Apr 25;15(4):e38108. https://doi.org/10.7759/cureus.38108
- Ashish S, Kalluraya P, Pai MM, Murlimanju BV, Rao Y, Prabhu LV, Agrawal A. Morphometric study of the lumbar vertebrae in dried anatomical collections. F1000Res. 2023 Dec 28;11:1408. https://doi.org/10.12688/f1000research.126879.3 PMid:37990689 PMCid:PMC10660310
- Abbas J, Hamoud K, May H, Hay O, Medlej B, Masharawi Y, Peled N, Hershkovitz Degenerative lumbar spinal stenosis and lumbar spine configuration. Eur Spine J. 2010 Nov;19(11):1865-73. https://doi.org/10.1007/s00586-010-1516-5 PMid:20652366 PMCid:PMC2989266
- Mitra SR, Datir SP, Jadhav SO. Morphometric study of the lumbar pedicle in the Indian population as related to pedicular screw fixation. Spine (Phila Pa 1976). 2002 Mar 1;27(5):453-9. https://doi.org/10.1097/00007632-200203010-00004 PMid:11880829
- Postacchini F. Surgical management of lumbar spinal stenosis. Spine (Phila Pa 1976). 1999 May 15;24(10):1043-7. https://doi.org/10.1097/00007632-199905150-00020 PMid:10332799
- Ebraheim NA, Rollins JR Jr, Xu R, Yeasting RA. Projection of the lumbar pedicle and its morphometric analysis. Spine (Phila Pa 1976). 1996 Jun 1;21(11):1296-300. https://doi.org/10.1097/00007632-199606010-00003 PMid:8725919
- Kim NH, Lee HM, Chung IH, Kim HJ, Kim SJ. Morphometric study of the pedicles of thoracic and lumbar vertebrae in Koreans. Spine (Phila Pa 1976). 1994 Jun 15;19(12):1390-4. https://doi.org/10.1097/00007632-199406000-00014 PMid:8066521
- Chaynes P, Sol JC, Vaysse P, Bécue J, Lagarrigue J. Vertebral pedicle anatomy in relation to pedicle screw fixation: a cadaver study. Surg Radiol Anat. 2001;23(2):85- 90. https://doi.org/10.1007/s00276-001-0085-z PMid:11462867
- Knipe H, Hacking C, Canal-to-body ratio of Torg and Pavlov. Reference article, Radiopaedia.org https://doi.org/10.53347/rID-163196
- Jones RA, Thomson JL. The narrow lumbar canal. A clinical and radiological review. J Bone Joint Surg Br. 1968 Aug;50(3):595-605. https://doi.org/10.1302/0301-620X.50B3.595
- Shrestha I. Mean Canal-Body Ratio among Specimens of Dried Lumbar Vertebrae in the Department of Anatomy of a Medical College. JNMA J Nepal Med Assoc. 2022;60(250):531-535. https://doi.org/10.31729/jnma.7328 PMid:35633217 PMCid:PMC9252235
- Been E, Kalichman L. Lumbar lordosis. Spine J. 2014 Jan;14(1):87-97. https://doi.org/10.1016/j.spinee.2013.07.464 PMid:24095099
- Varol T, Iyem C, Cezayirli E, Erturk M, Kayalioglu G, Hayretdag C. Comparative morphometry of the lower lumbar vertebrae: osteometry in dry bones and computed tomography images of patients with and without low back pain. J Int Med Res. 2006 May-Jun;34(3):316-30. https://doi.org/10.1177/147323000603400312 PMid:16866027
- Zindrick MR, Wiltse LL, Doornik A, Widell EH, Knight GW, Patwardhan AG Thomas JC, Rothman SL, Fields BT. Analysis of the morphometric characteristics of the thoracic and lumbar pedicles. Spine (Phila Pa 1976). 1987 Mar;12(2):160-6. https://doi.org/10.1097/00007632-198703000-00012 PMid:3589807
- Bajwa, N. S., Toy, J. O, Ahn, N. U. Application of a correlation between the lumbar Torg ratio and the area of the spinal canal to predict lumbar stenosis: a study of 420 postmortem subjects.Journal of orthopaedics and traumatology: official journal of the Italian Society of Orthopaedics and Traumatology, 2013;14(3):207-212. https://doi.org/10.1007/s10195-013-0237-z PMid:23575641 PMCid:PMC3751274
- Qudsieh H, Al-Rawashdeh I, Daradkeh A, Abualnadi T, Al Tah B. Variation of Torg-Pavlov ratio with age, gender, vertebral level, dural sac area, and ethnicity in lumbar magnetic resonance imaging. J Clin Imaging Sci. 2022 Sep 1;12:53. https://doi.org/10.25259/JCIS_67_2022 PMid:36325496 PMCid:PMC9610521
- Panjabi MM, Goel V, Oxland T, Takata K, Duranceau J, Krag M, Price M. Human lumbar vertebrae. Quantitative three-dimensional anatomy. Spine (Phila Pa 1976). 1992 Mar;17(3):299-306. https://doi.org/10.1097/00007632-199203000-00010 PMid:1566168


